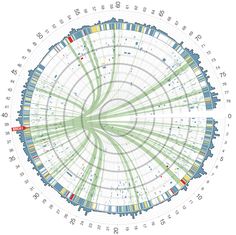
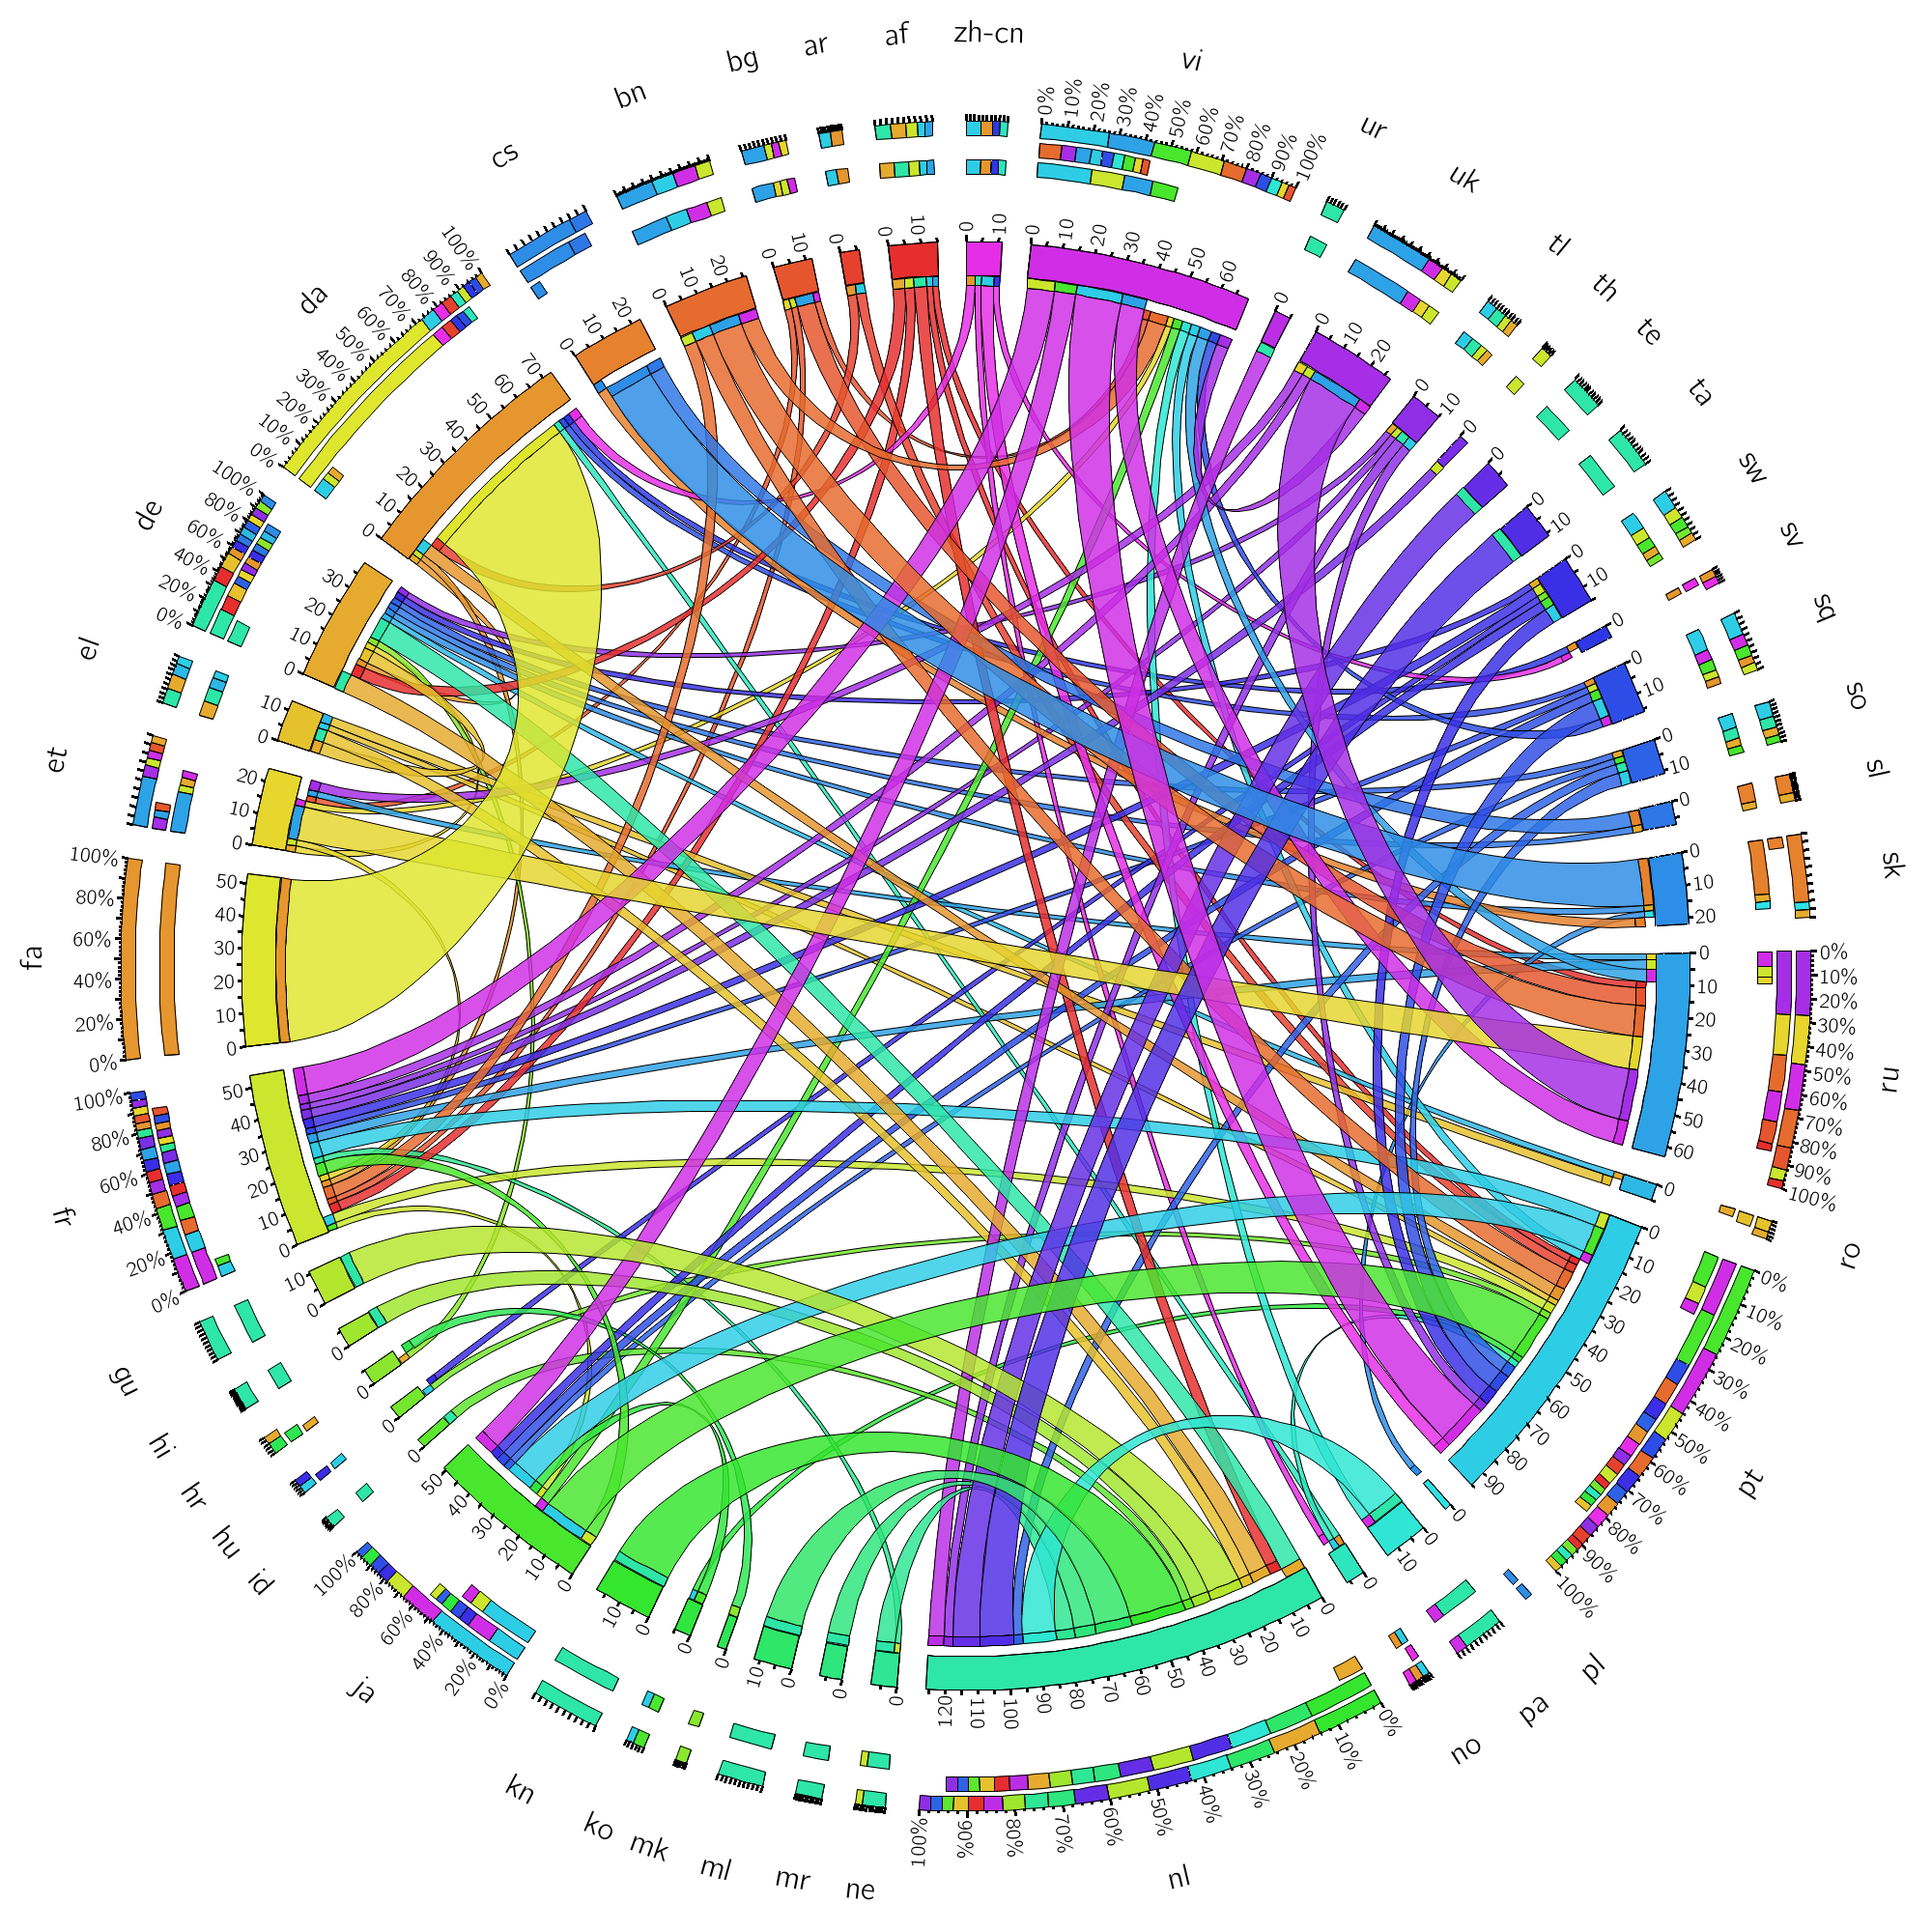
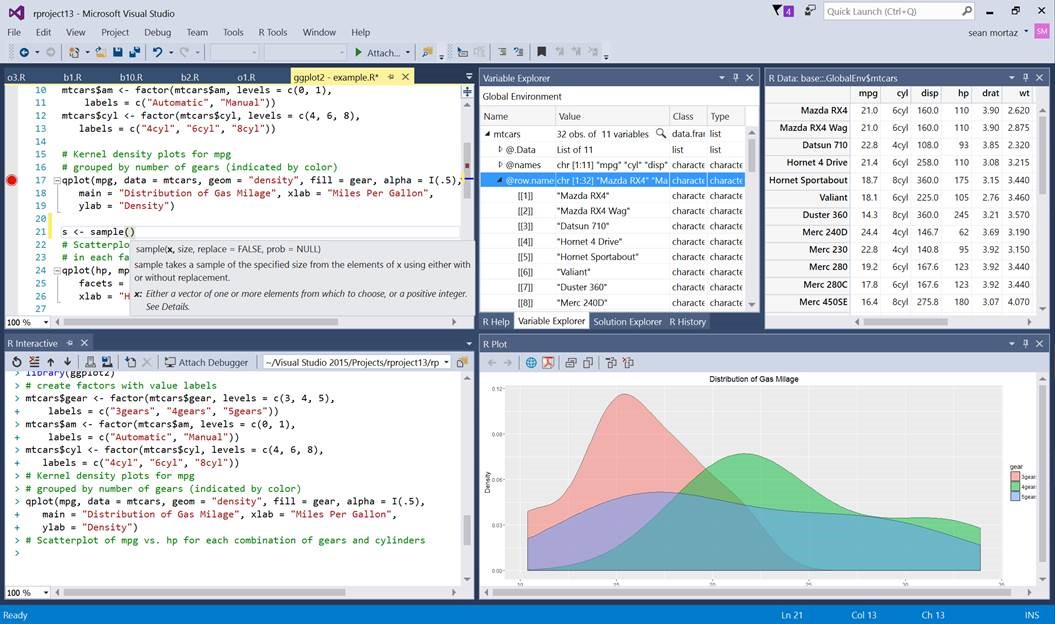
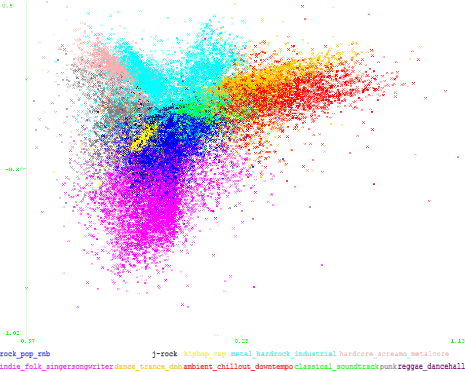
Here we ask you to identify which data visualization tool was used to produce the following 18 charts: 4 were done with R, 3 with SPSS, 5 with Excel, 2…
If you are from the finance, sales, marketing or operations sector, then you must have noticed that massive data is crawling into your everyday life. No doubt it will keep…


Introduction R is the most commonly used tool in analytics industry today. No doubt, python is catching up quickly. Many companies which were heavily reliant on SAS, have now started R…
Data Frames are the tables to store data. If you recall the vectors from the first R notes data frames can be imagined as the collection of vectors with same…
[Introduction of Association Rules] Sometimes, the anecdotal story helps you understand the new concept. But, this story is real. About 15 years ago, in Walmart, a sales guy made efforts…
Summary: Picking an analytic platform when first starting out in data science almost always means working with what we’re most comfortable. But as organizations grow larger there is a need…
Page 1 of 1