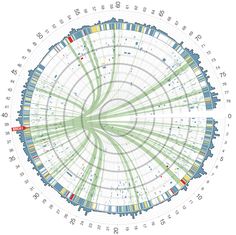
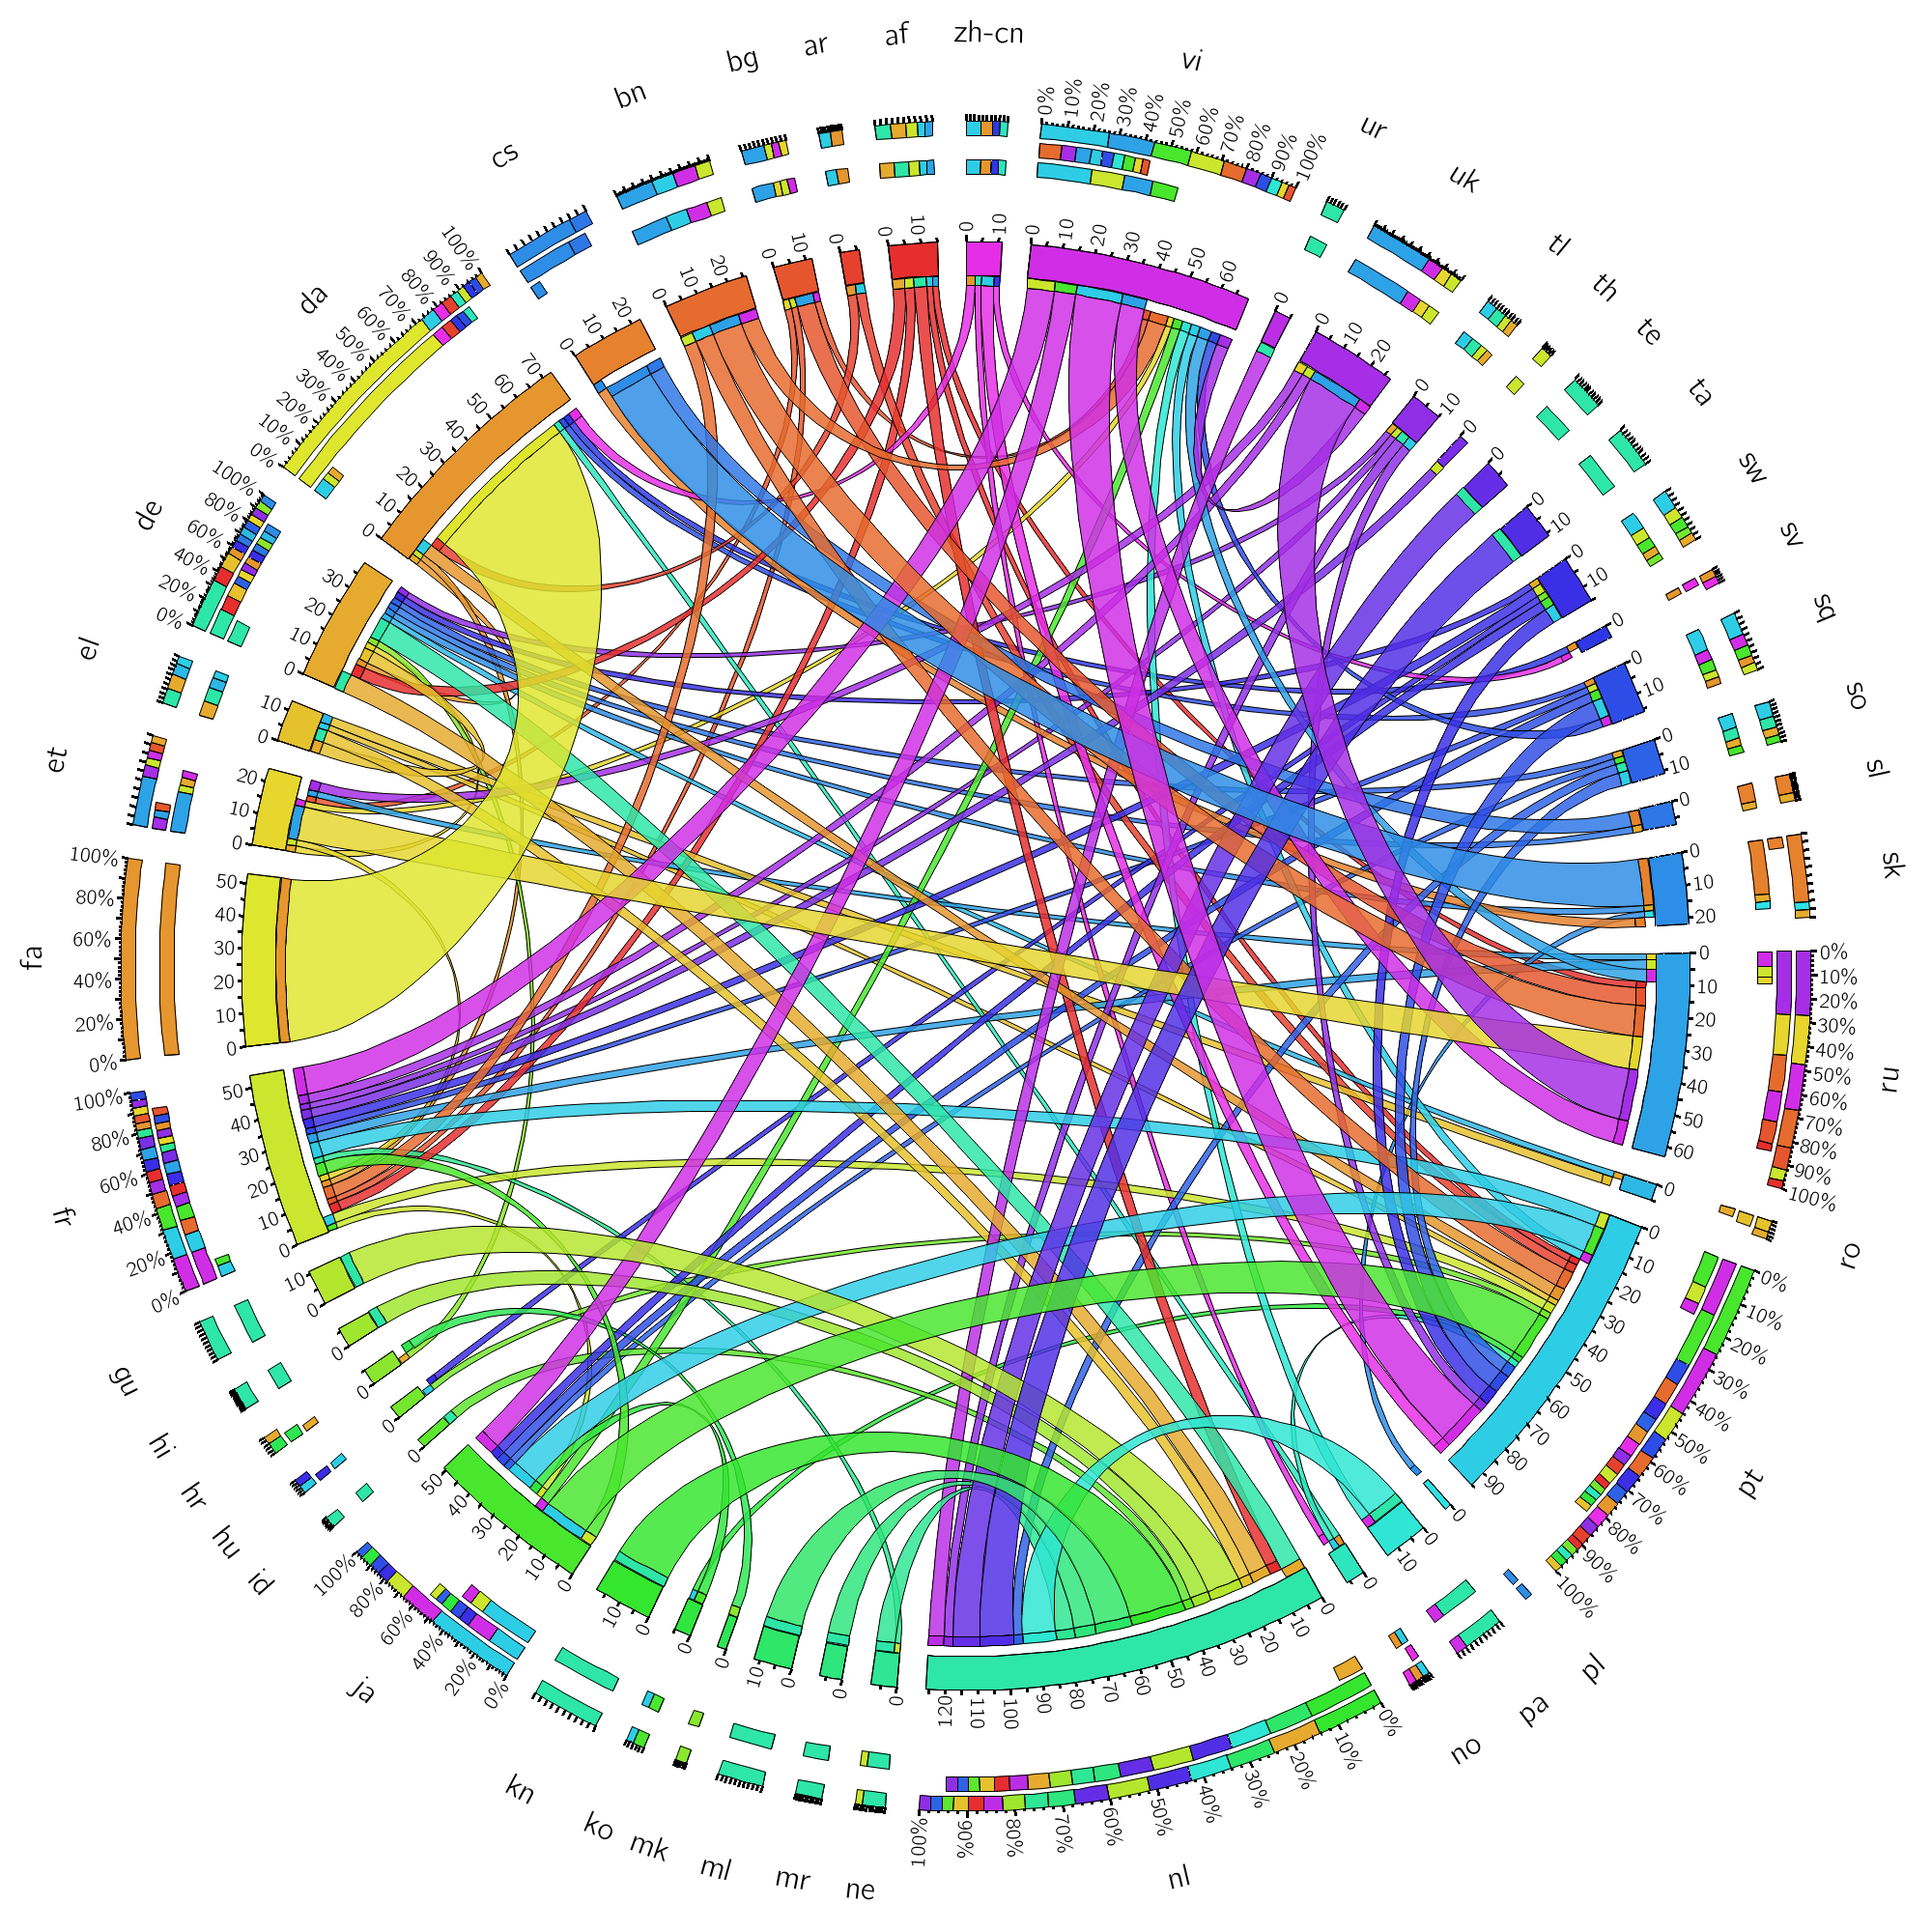
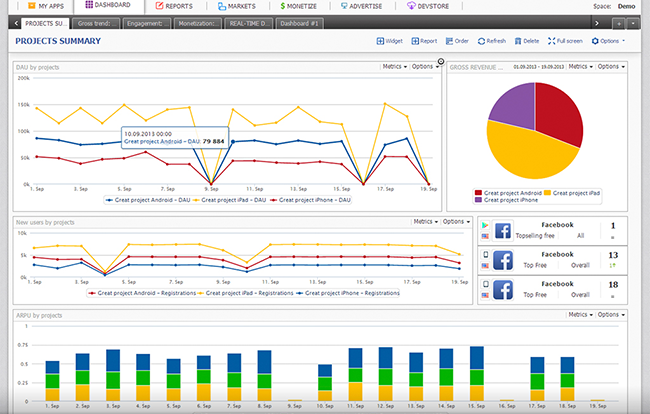
Here we ask you to identify which data visualization tool was used to produce the following 18 charts: 4 were done with R, 3 with SPSS, 5 with Excel, 2…
If you are from the finance, sales, marketing or operations sector, then you must have noticed that massive data is crawling into your everyday life. No doubt it will keep…

Summary: Picking an analytic platform when first starting out in data science almost always means working with what we’re most comfortable. But as organizations grow larger there is a need…
Page 1 of 1