Chimes on KNIME

Article By:
Santanu Dutta
Introduction
“What can be a better time to attain enlightenment through knowledge as we celebrate Diwali in this part of world. What can be a better reason, a quest for an analytical tool. “
This weekend, I have gone through the enjoyment and excitement of an adventure in the colorful wonderland of KNIME. I could not resist myself sharing experiences of this journey with you.
KNIME , the Konstanz Information Miner is an open source (GNU GPL available at http://www.gnu.org/licenses/ gpl.html) data analytics platform with a large set of building blocks and third-party tools. It can be used for loading data , building model ,predicting new value using a previously found model , preparing reports.
How to Install KNIME
Various operating systems on 32-bit and 64-bit x86 platforms support KNIME . These operating systems are: Windows and Linux, Mac OS X (10.6 and above).
Organizing work
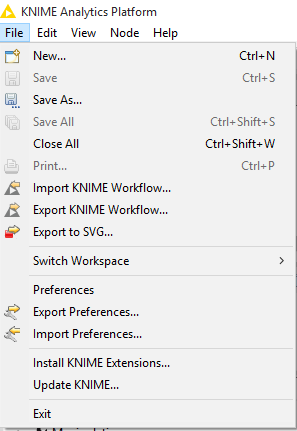
When KNIME starts the first time a welcome screen opens.
From here we can Open KNIME workbench, get additional nodes. In addition to the ready-to-start basic KNIME installation there are additional plug-ins for KNIME e.g. an R and Weka integration, or the integration of the Chemistry Development Kit with additional nodes for the processing of chemical structures, compounds, etc. We can download these features also later from within KNIME (File, Update KNIME.)
Workbench overview
The KNIME Workbench is organized as follows:
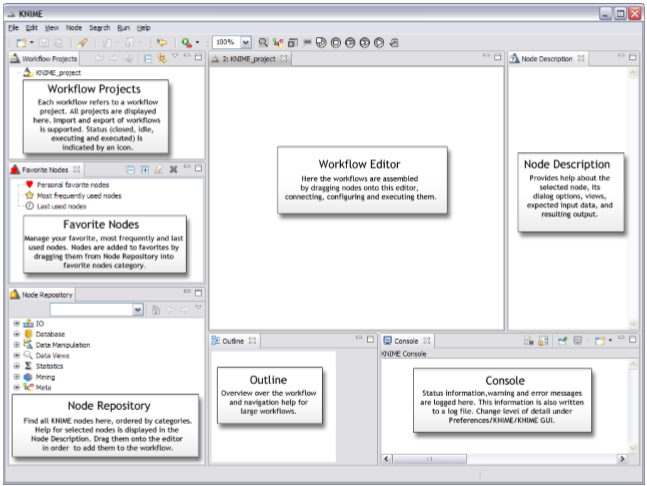
Building a workflow
We can store our files in a workspace. When KNIME starts, we can specify which workspace we want to use. The workspace contain settings and logs. It also contain workflow groups or workflows. The groups are like folders in a file system that help organize our workflows.
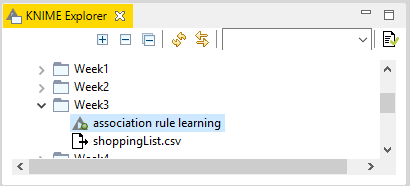
Workflows may be programs and processes that explains various steps that can be applied to load, analyze , visualize, transform the data , preparing models , generating output and preparing report. Workflows may contain nodes, meta nodes, connections, workflow variables, workflow credentials and annotations besides previously introduced metadata. Workflow credentials is the place where we can store login name and password for connections.
Node Repository contain IO nodes (to read files, write files), Manipulation ,Views , Analytics ,Database, Scripting, Social Media , Reporting etc. IO nodes various file readers.
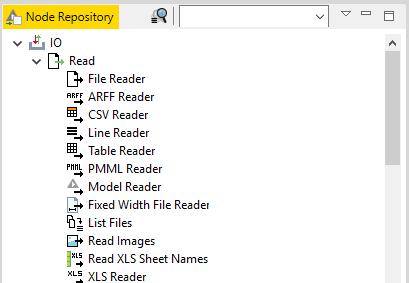
A workflow is built by dragging nodes from the Node Repository onto the Workflow Editor and connecting them. Nodes are the basic processing units of a workflow. Each node has a number of input- and/or output ports. Data (or a model) is transferred over a connection from an out-port to the in-port of another node.
Node Status
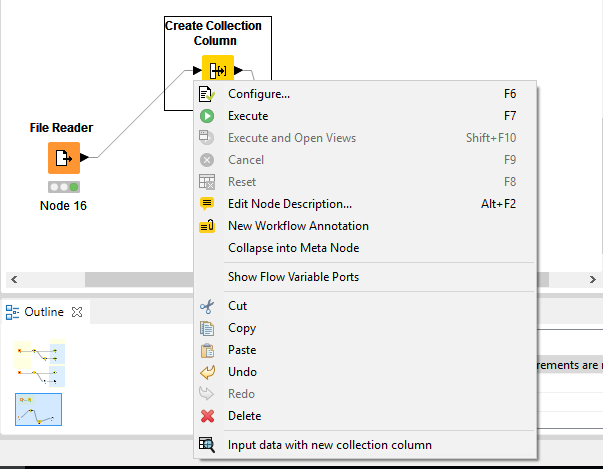
When a node is dragged onto the workflow editor the status light shows red, which means that the node has to be configured in order to be able to be executed. A node is configured by right clicking it, choosing , ‘Configure’, then adjusting the necessary settings in the node’s dialog.
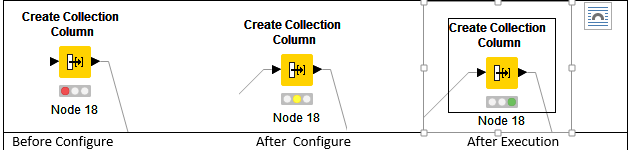
When the dialog is closed by pressing the ‘OK’ button, the node gets configured and the status light changes to yellow and the node is ready to be executed. Right-click on the node again shows an enabled ‘Execute’ option. If we press, it will execute the node and the result of this node will be available at the out-port. After a successful execution the status light of the node is green. The result(s) can be inspected by exploring the out-port view which is the last entries in the context menu .
Ports
Ports on the left are input ports, where the data from the out-port of the predecessor node is provided. Ports on the right are out-ports. The result of the node’s operation on the data move to the out-port of successor nodes. A tooltip gives information about the output of the node, further information can be found in the node description. Nodes are typed such that only ports of the same type can be connected.
Data Port:
It is the most common type of node (a white triangle) ,which transfer data tables from node to node.
Database Port:
Database ports execute commands inside a database and can be recognized by their (brown square):
PMML Ports:
A PMML port can be identified by a blue squared. Data Mining nodes learn a model which is passed to predictor node.
Others:
Gray square Ports are “unknown” types. It is neither data, database, PMML, or ports for structured data. Whenever a node provides data which does not fit a flat data table structure a general purpose port for structured data is used (dark cyan square).
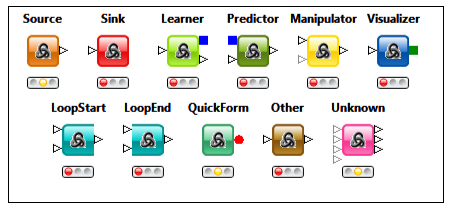
Type of Nodes
Every node has a type. It identifies the algorithm the node signifies. It specifies how to execute for different inputs and parameters, and what result we can expect. The nodes can be visualized as something similar to functions in programs. The node types are organized according to the following general types, which specify the color and the shape of the node for easier understanding of workflows. Various node types are shown as follows:

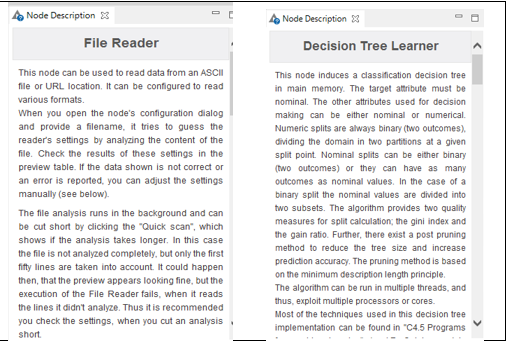
A node documentation describe what can be achieved using that type of node, tips. It also contains information about parameters and possible input ports and output ports.
Let’s create a Workflow:
With the above understanding lets create our first Workflow. We will create a simple workflow on famous Iris dataset.
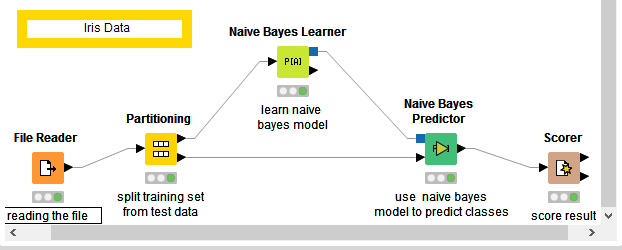
Step1: From Node Repository drag to Workspace File reader
IO -> Read -> File Reader
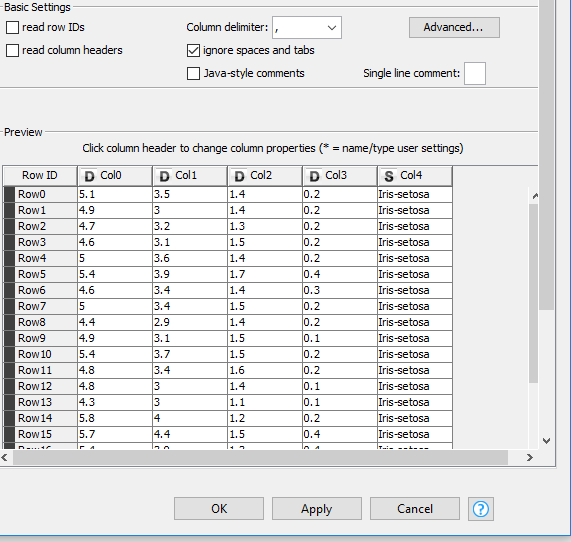
File Reader :This node can be used to read data from an ASCII file or URL location. It can be configured to read various formats.
Lets right click on the node. Then press configure. In valid url we have to insert path.
Step2 : From Node Repository drag to Workspace Partitioning .
Manipulation -> Row -> Transform -> Partitioning
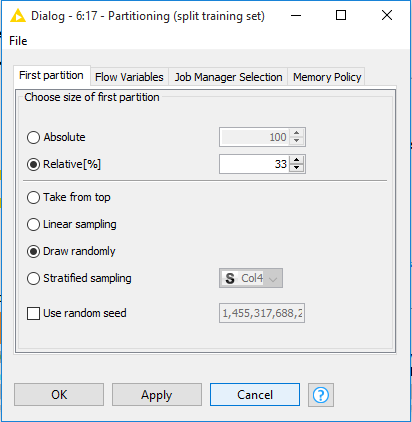
Partitioning : The input table is split into two partitions (i.e. row-wise), e.g. train and test data. The two partitions are available at the two output ports
Lets right click on node and configure. We can insert a value to describe the split in Relative(%).
Step3 : From Node Repository drag to Workspace Naïve Bayes Learner.
Mining -> Bayes -> Naïve Bayes Learner
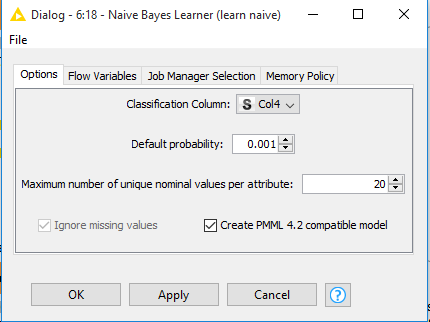
Naïve Bayes Learner : The node creates a Bayesian model from the given training data. It calculates the number of rows per attribute value per class for nominal attributes and the Gaussian distribution for numerical attributes.
Right click / double click to configure.
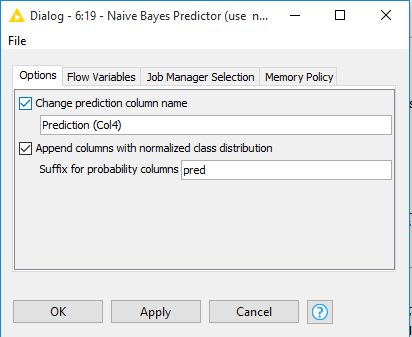
Step4 : From Node Repository drag to Workspace Naïve Bayes Predictor.
Mining -> Bayes -> Naïve Bayes Predictor
Naïve Bayes Predictor : Predicts the class per row based on the learned model. The class probability is the product of the probability per attribute and the probability of the class attribute itself
Right Click and configure. We can change prediction column name and append probability columns.
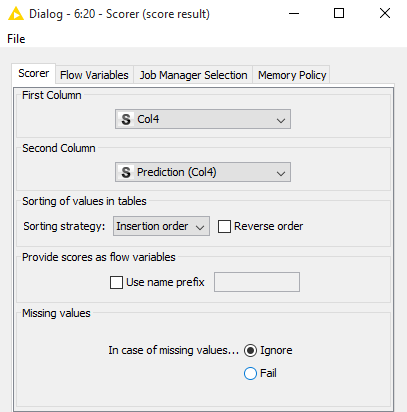
Step5 : From Node Repository drag to Workspace Scorer.
Mining -> Scoring -> Scorer
Scorer: Compares two columns by their attribute value pairs and shows the confusion matrix, i.e. how many rows of which attribute and their classification match. Additionally, it is possible to highlight cells of this matrix to determine the underlying rows
Right click on scorer node and configure. Insert in first column the dependent variable and in second column the predicted column.
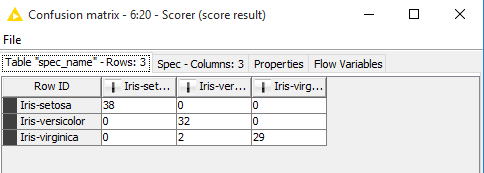
We are ready with our workflow. Lets see the output. An evaluation metric , Confusion Matrix can be seen on right click and pressing Confusion Matrix.
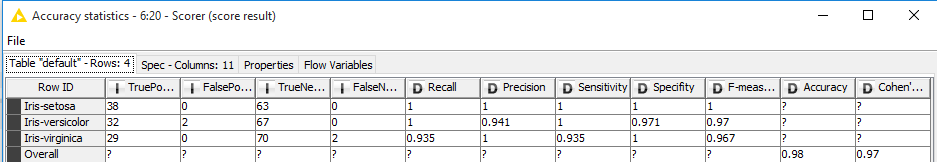
Accuracy Statistics can also be seen from scorer node.
End Thoughts
This article took us through the entire journey of understanding an analytic tool and solving a data science problem on a simple dataset. Complex workflows can be created to perform social media analytics by creating a connection to the Google Analytics API , Twitter’s API . We can also use Groovy Scripting features. There is plenty of area to research and quench the thirst of knowledge.
Looking ahead for some more expeditions with you in future.
Author: Santanu Dutta
Profile: Santanu is a Data Science evangelist. An analytics professional with more than 6 years of successful career in Banking, Insurance, Retail. He is Post Graduate in Management, Chartered Associate in Banking ( CAIIB ), NCFM , AMFI certified. He is interested in machine learning problems involving the integration of multiple learning strategies, investigations into implicit and explicit learning, and modelling novelty solutions to computer science and real life problems.


shan2 Posts
✔ I am a Data Science Evangelist. ✔ Post Grad in Management ✔Chartered Associate in Banking ( CAIIB ), NCFM , AMFI qualified. I enjoy applying machine learning techniques to applications involving such issues as feature extraction, statistical data analysis, information retrieval, predictive modelling, data mining and adaptive user modelling.


4 Comments
Aditya
October 26, 2016 at 10:14 amThis is a wonderful description of a tool to see through the beautiful of world of numbers. Hat’s off man..
Kalyan Banga
October 26, 2016 at 10:30 amThank you Aditya for the kind works! Hope to keep up the momentum with many such information articles. Keep visiting Fusion Analytics World
Moushumi
October 29, 2016 at 4:41 amWoow, thanks for providing an awesome technical idea to the world…
Kalyan Banga
October 29, 2016 at 6:02 amThank you Moushumi for the kind words, visit our website regularly and follow is on social channels for updates.
Web: http://fusionanalyticsworld.com
LinkedIn: http://www.linkedin.com/company/fusion-analytics-world
Facebook: http://www.facebook.com/AnalyticsFusion
Twitter: http://twitter.com/analyticsfusion