Atlas for Africa, a Free Data Visualization Platform
It’s no secret that a lack of reliable data is a problem for many African countries. For companies and investors, the true size and growth of the continent’s middle class ranges wildly. For those outside of Africa, entire regions or the continent as a whole, often go missing from world maps.
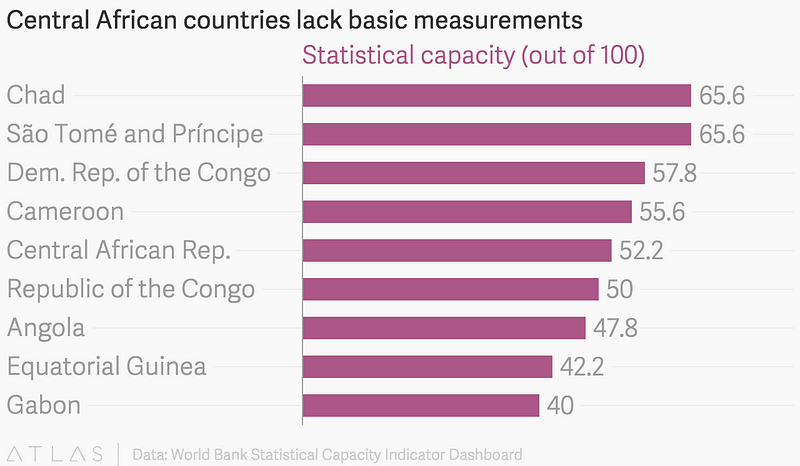
African leaders and governments are shooting in the dark when it comes to policy-making — as are the experts overseeing the progress of the United Nations’ flagship Millennium Development Goals project (MDG). Last year, 65% of the MDG indicators for Central African countries were either estimated or came from data sources more than five years old:
This dearth of good data is especially pronounced when it comes to journalism in Africa. African journalists and media organizations face the challenge not only of getting access to relevant data but finding the tools to present that data. Initiatives like Code for South Africa have been launched to train journalists in technical skills. Billionaire philanthropist Mo Ibrahim has launched an online tool with 15 years of statistics collated through censuses, surveys and other sources. Kenya’s The Nation has recently invested in a data journalism team, Newsplex, to focus on data-driven stories.
There’s more that can be done. That’s why we’ve applied for the Innovate Africa fund to take Quartz’s chart-building platform, Atlas, to newsrooms, journalism schools, and other organizations in half a dozen African countries for free. We’d offer training in how to use Atlas as well as work with local partners developing specific data-driven reporting projects. We’d also like to create database with an intuitive interface that collects and sorts links to Africa-related data resources — Atlas for Africa.
Our goal is to promote better presented and supported stories about Africa, for Africans, something that we have tried to do at Quartz Africa. Quartz Africa, launched last year, sees Africa as home to some of the world’s fastest growing economies, a hotbed of trade and investment, and a global laboratory for innovation. Data is an important part of that and Atlas, centered on storytelling and collaboration, has been instrumental to our coverage.
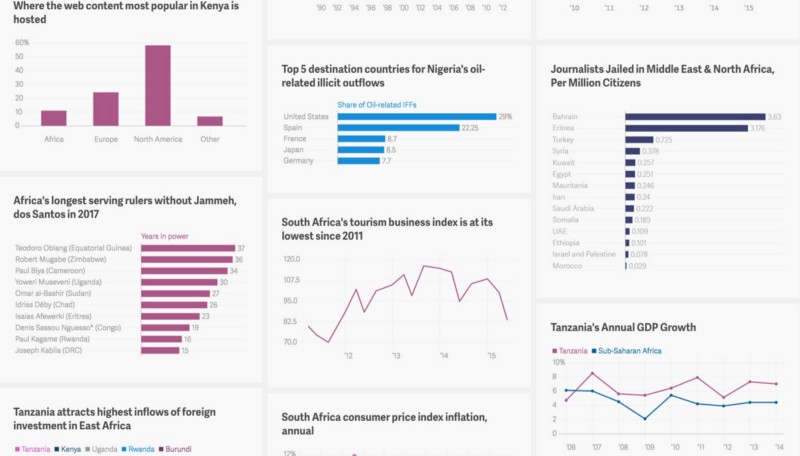
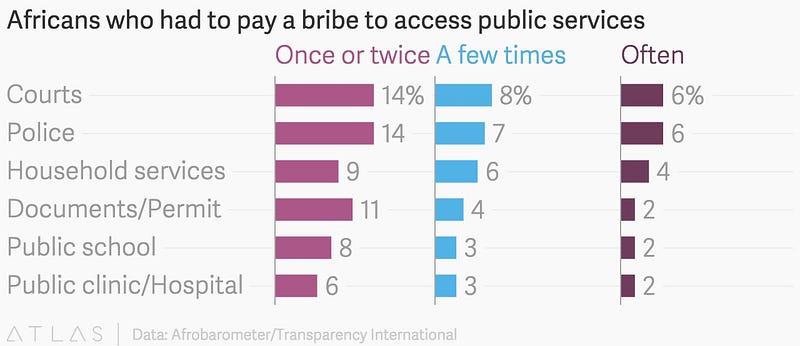
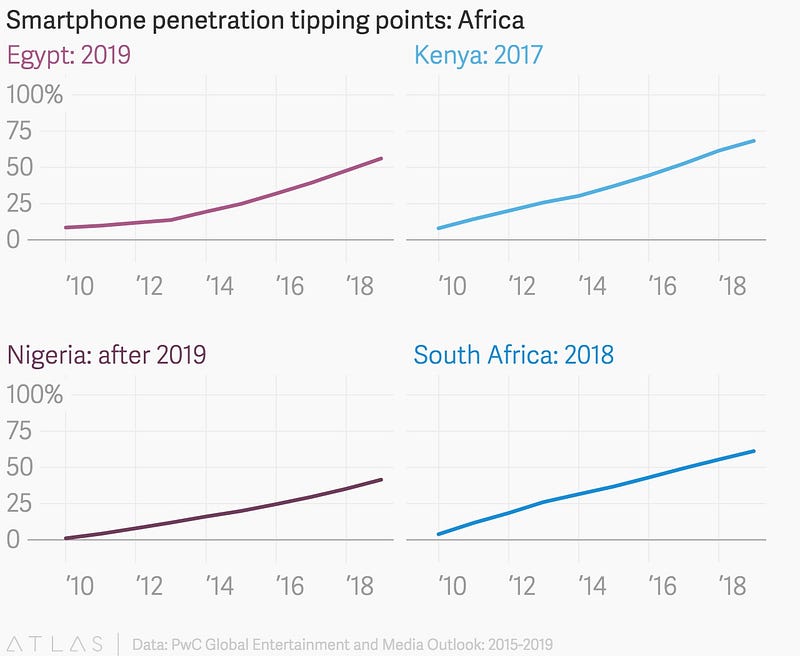
We have used Atlas charts to show how East African countries rank in attracting foreign investment, how China now owns more than half of Kenya’s external debt, the percentage of Africans in various countries that have had to pay a bribe to get public services, or the tipping point for smartphone on the continent.
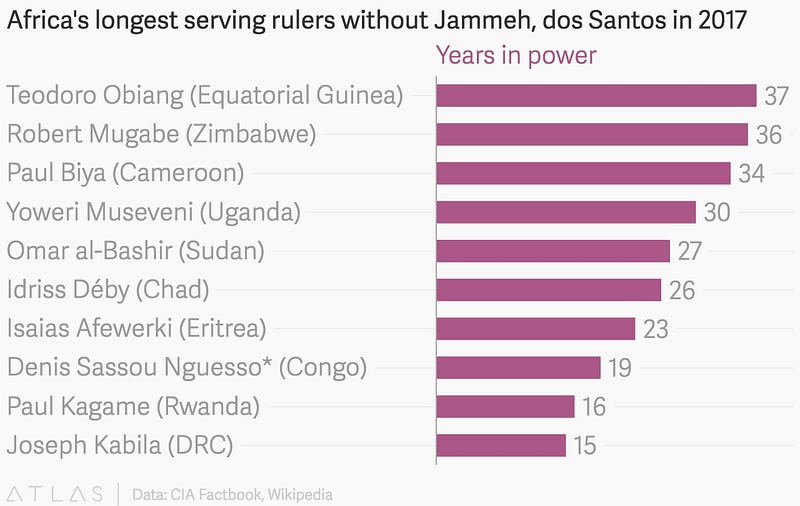
Atlas has helped us visualize breaking news quickly, like what Africa’s list of long-ruling leaders would look like if Gambia’s Yahya Jammeh and Angola’s Eduardo Dos Santos step down, as they promised to do in early December.
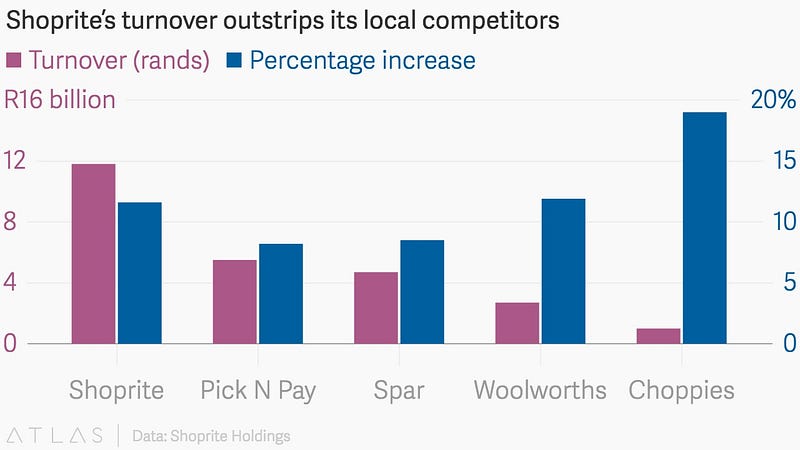
Data visualizations are critical to features stories, like our recent report on how South Africa’s grocery chain Shoprite managed to become Africa’s largest retailer.
Better data and tools for African newsrooms, independent journalists, and other organizations is important for keeping governments and politicians in check, for attracting potential investors, and supporting local businesses. Better, shared data could lower the cost of cancer treatment on the continent, as we recently reported. With the explosion of mobile money, internet penetration, and smartphones, there is more data being generated in Africa than ever before. No wonder the collection and research of consumer data is a fast-growing business sector across the continent.
Having accurate and reliable data in itself won’t overcome all of Africa’s challenges, whether in governance, economic growth, and social stability, but it’s the first step in knowing how to address these obstacles.
27 comments
Profile Status
ACTIVE
Profile Info


Kalyan Banga226 Posts
I am Kalyan Banga, a Post Graduate in Business Analytics from Indian Institute of Management (IIM) Calcutta, a premier management institute, ranked best B-School in Asia in FT Masters management global rankings. I have spent 14 years in field of Research & Analytics.


0 Comments